Plants and Soil Sensors

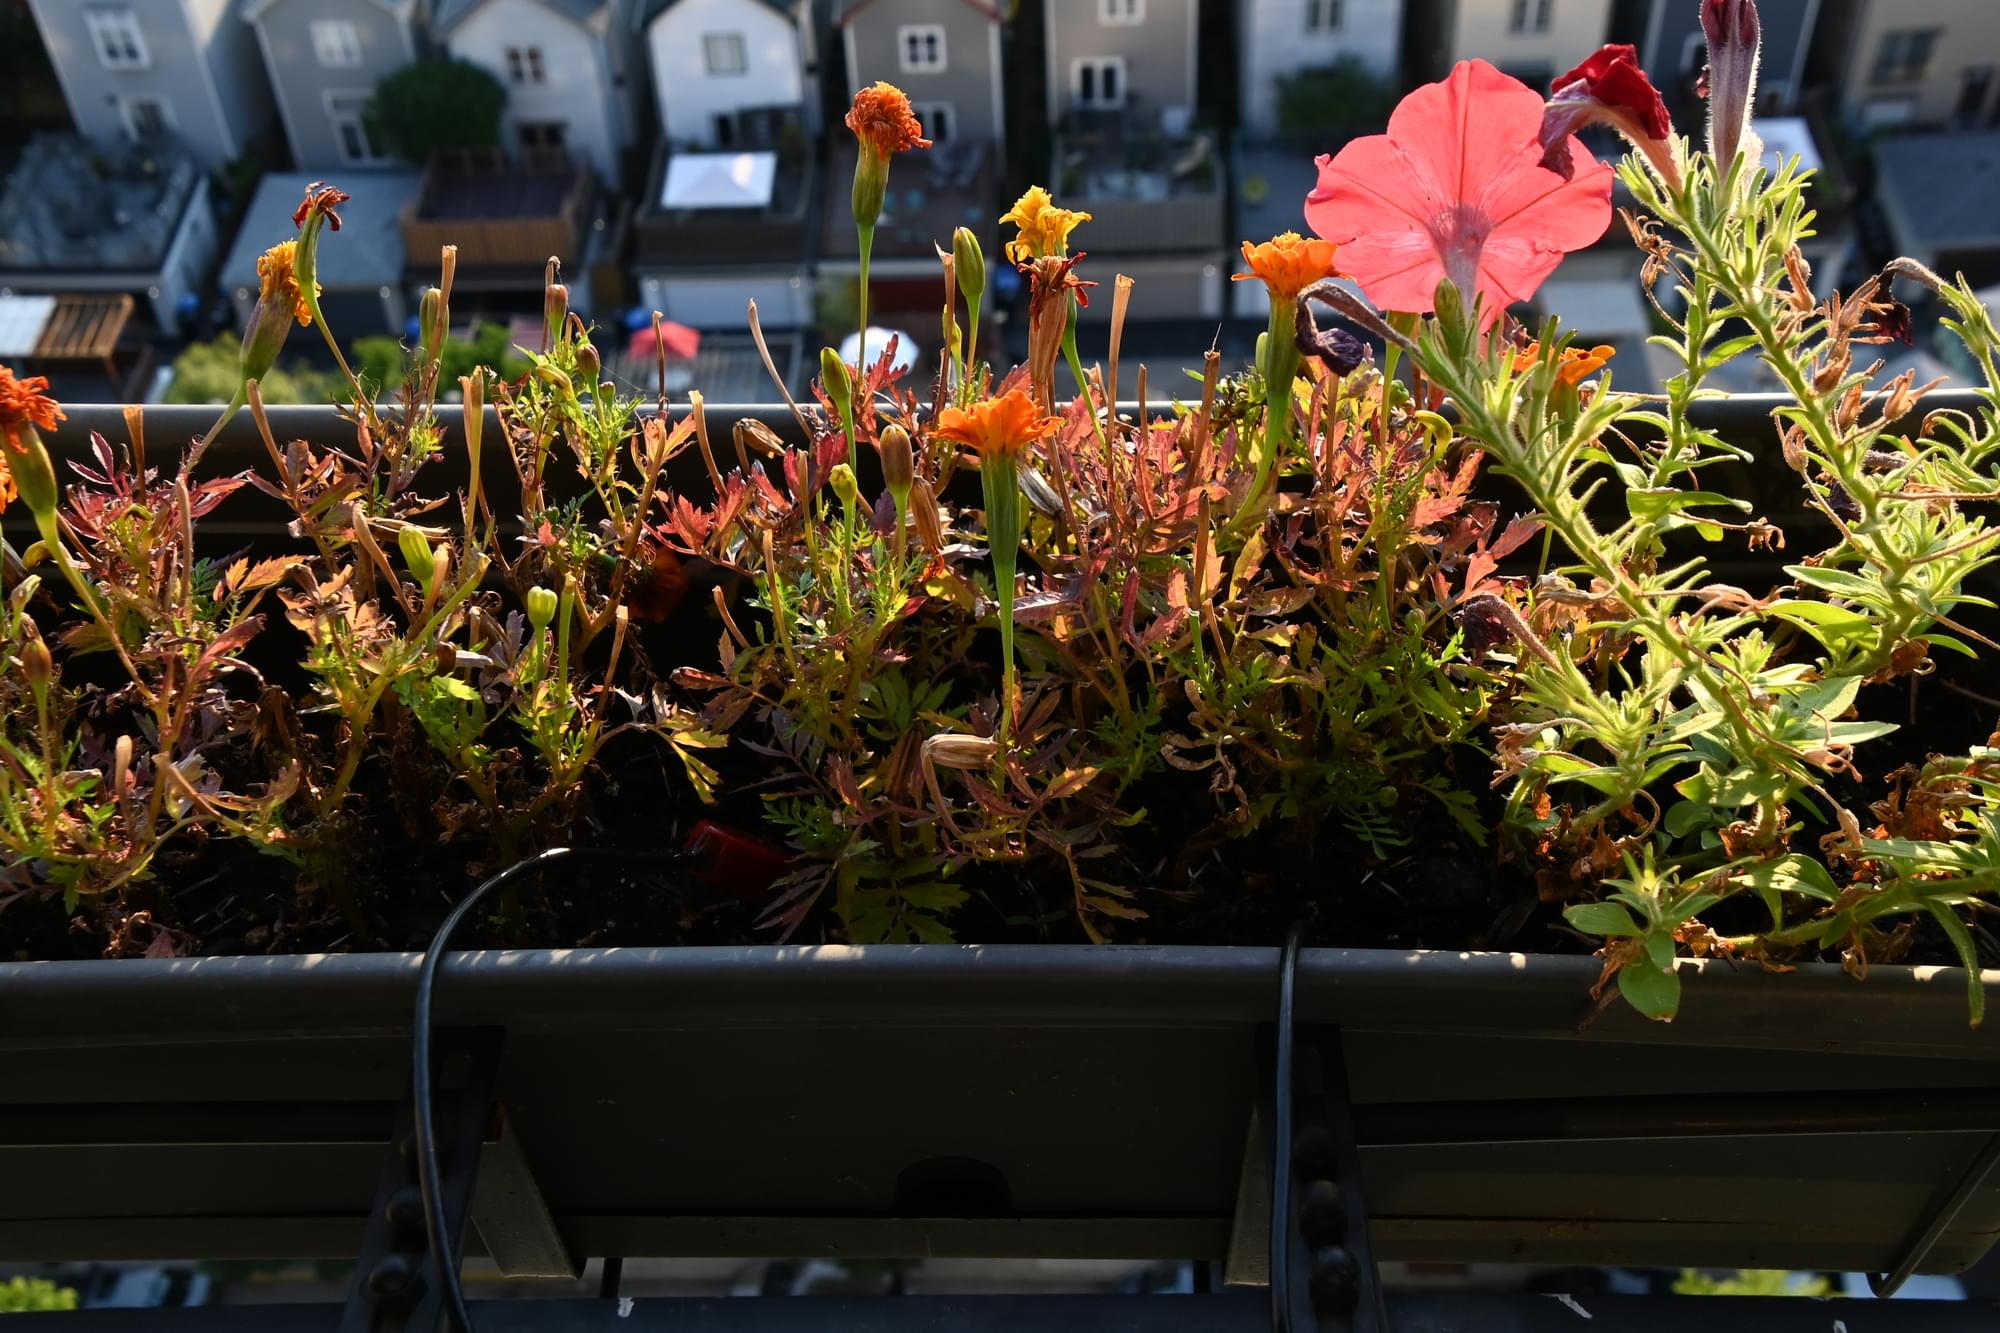
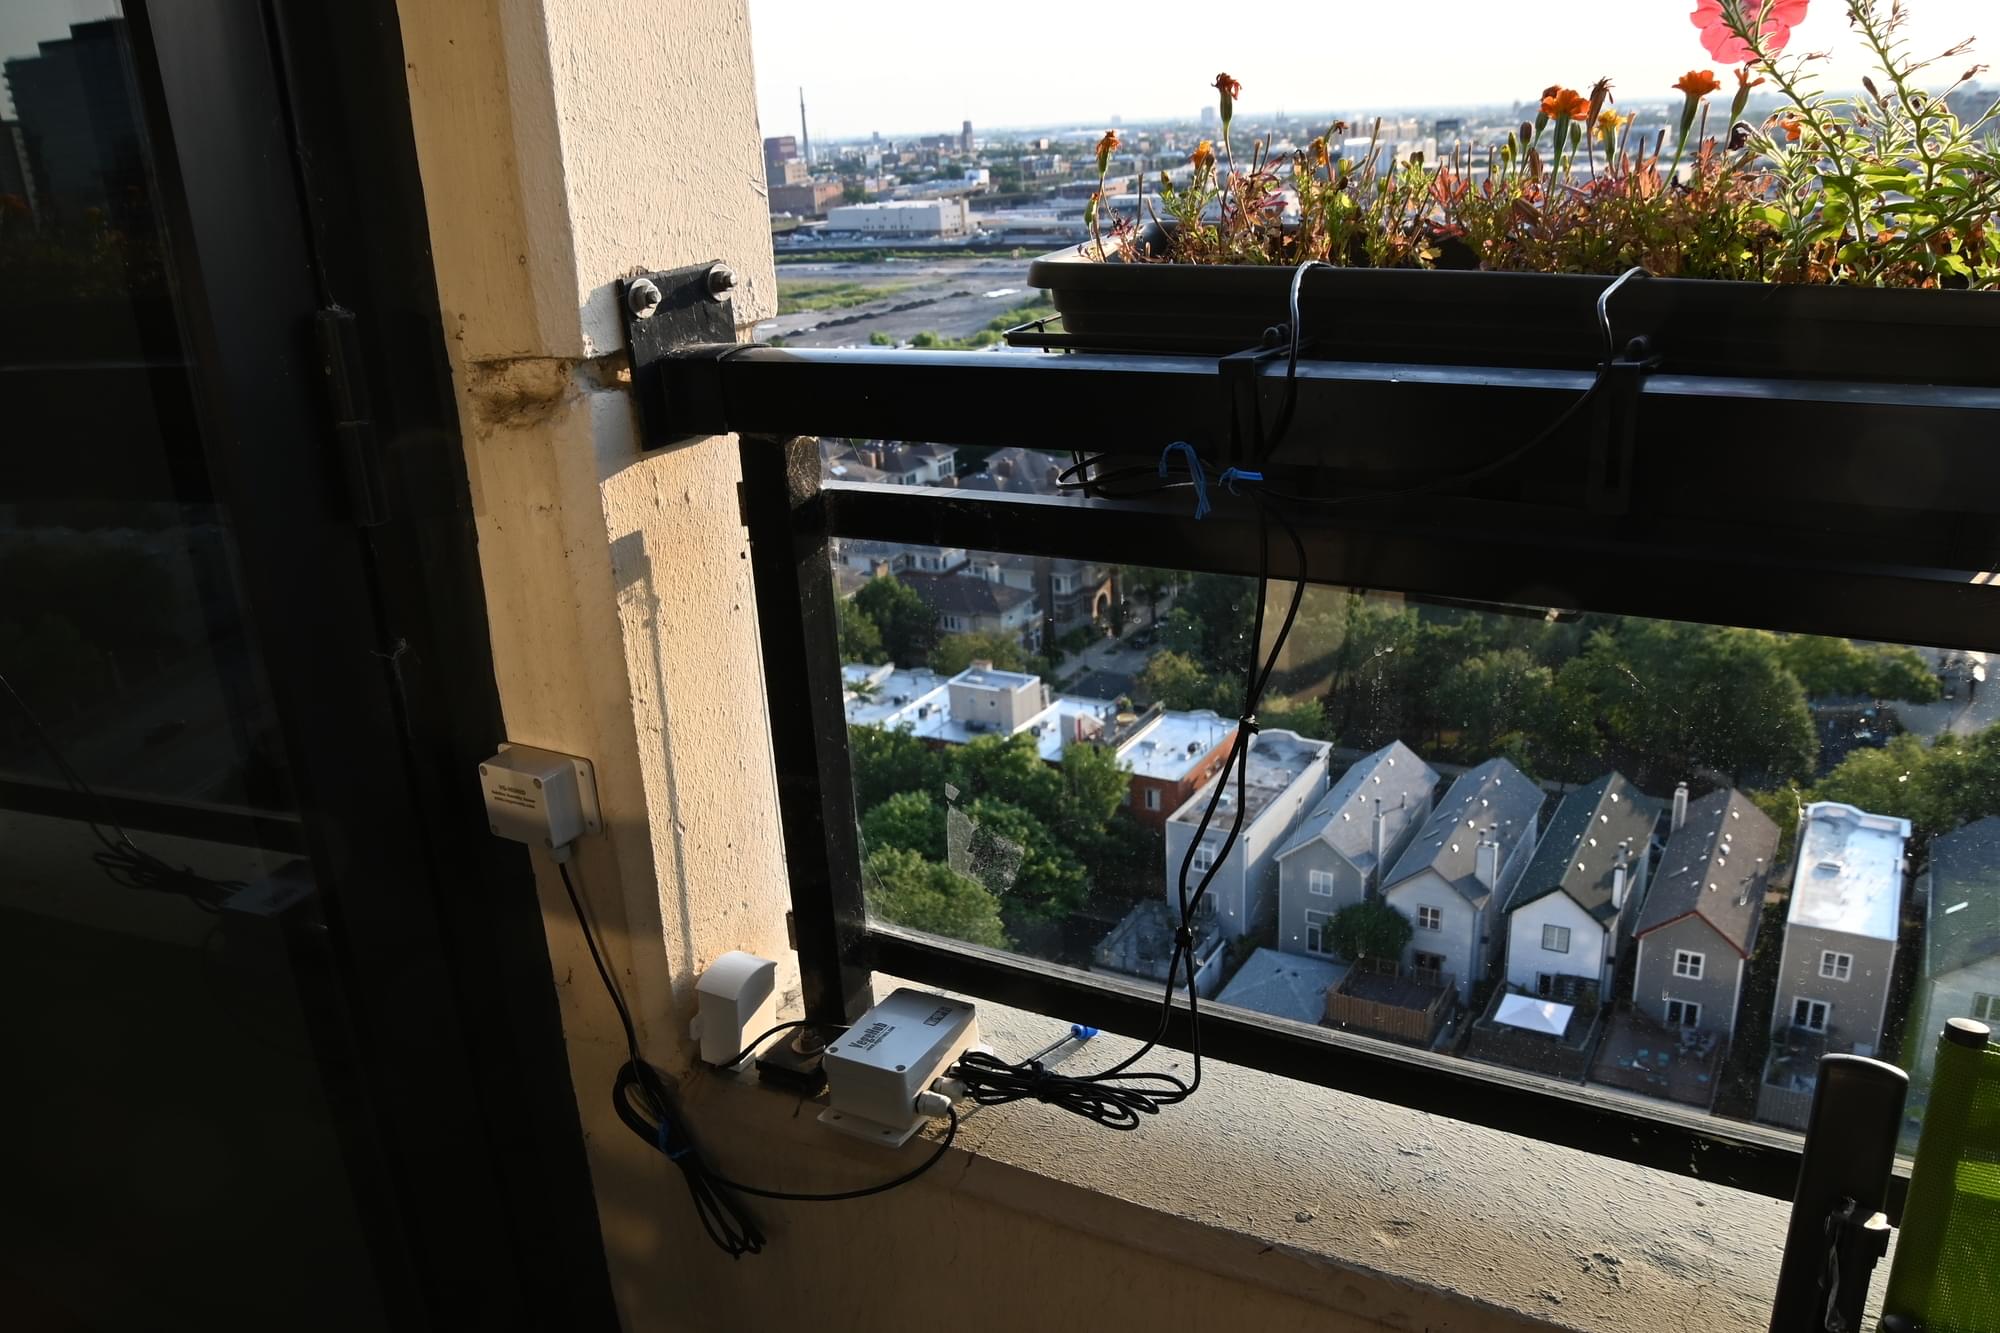
A few years back, I did some work for a sensor network startup. Since then, I’ve always been on the lookout for new sensor hardware and tools. I just moved into a new apartment, and discovered the VegeHub when searching for soil moisture sensors to use on my flower boxes.
The VegeHub supports sending your data to a few online storage providers (a.k.a The Cloud), or to a custom web service. I considered adding support to BigSense, a sensor web service I wrote in Scala. Instead, I decided it would be a good time to experiment with a time series database. I wrote a small Python Flask application called SenseFlux to store VegeHub data in InfluxDB. In this post, I’ll show you how you can setup SenseFlux and InfluxDB using Docker, and graph sensor data using chronograf. Let’s get started.
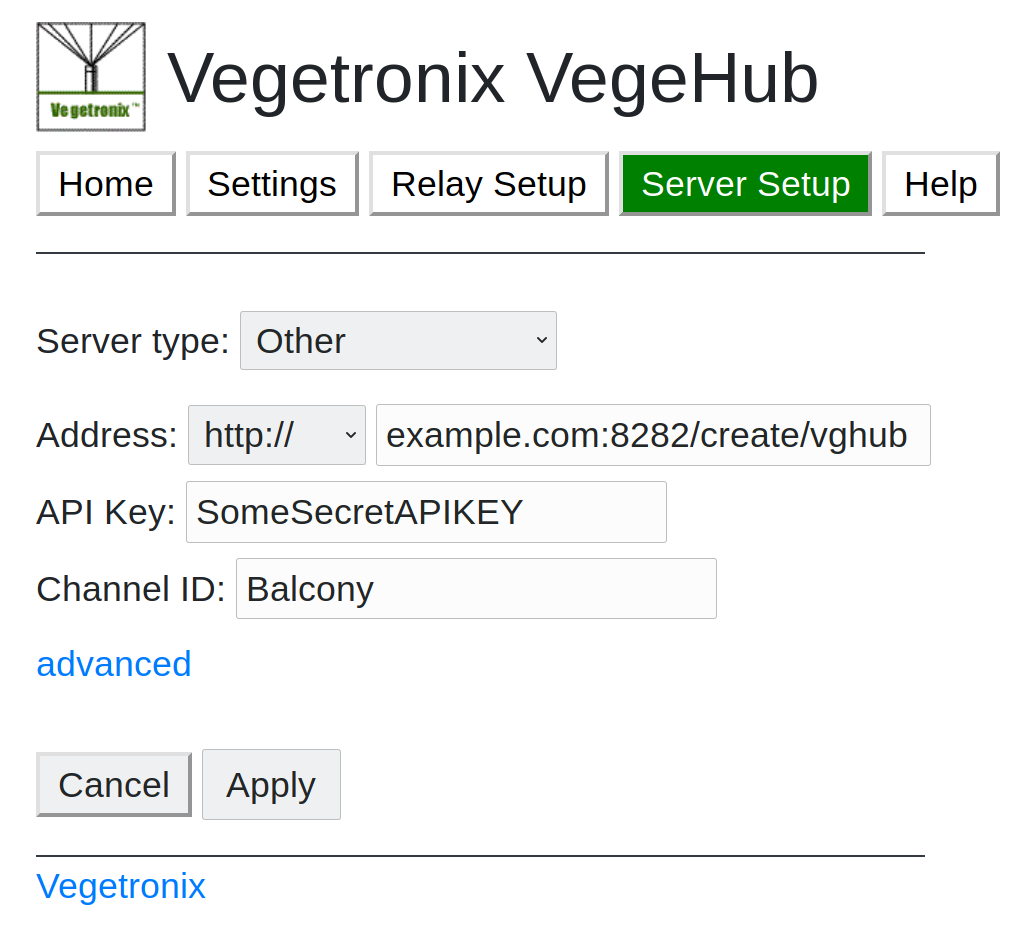
The VegeHub’s web interface allows you to set a custom web service endpoint, an API Key and a Channel ID. The Channel ID is what SenseFlux will use to identify the sensor data and store it InfluxDB. SenseFlux will also use the API key for validation.
SenseFlux is a Python application which uses Flask for its application framework and Waitress for its web server. It can accept data from a VegeHub sent to the /create/vghub endpoint. The data is stored in InfluxDB and can be viewed using tools like Chronograf. The easiest way to get started is to run these components in Docker containers. The following establishes a Docker network and then creates the appropriate containers for InfluxDB and SenseFlux, exposing the SenseFlux port on the host machine.
docker network create sensenet

docker run -d --name influx-sf --network sensenet \
    -e INFLUXDB_USER=influx \
    -e INFLUXDB_USER_PASSWORD=<SecurePassword> \
    -v influx-state:/var/lib/influxdb \
    influxdb

docker run -d --name senseflux-sf --network sensenet -p 8003:8003 \
    -e SF_API_KEY=TESTKey \
    -e INFLUXDB_HOST=influx-sf \
    -e INFLUXDB_USER=influx \
    -e INFLUXDB_PASSWORD=<SecurePassword> battlepenguin/senseflux:v0.0.9 \
    -e FIELD1=Humidity \
    -e FIELD2=SoilTemperature \
    -e FIELD3=SoilMoisture \
    -e FIELD4=Darkness
    -e FIELD5=Battery
In the above example, create a secure password for <SecurePassword>, and set each field input to the appropriate sensor type. Ensure the SF_API_KEY matched what’s configured on the VegeHub. Fields that are not defined will default to the type Voltage, scaling the range of 0.0 to 3.0 volts to a number between 0 and 100.
VegeHub Review
The setup I purchased was $285 (USD) including individual sensors and shipping.
| Part No | Part | Cost (USD) |
|---|---|---|
| THERM200-2M | Soil Temperature Sensor | $33.95 |
| VG-HUMID-2M | Relative Humidity Sensor with 2 meter Power Cable | $37.95 |
| VG-HUB4-RELAY | VegeHub: 4 channel Wifi Sensor Hub with Relay | $139.95 |
| BATTERY-BOX-6AA | Rain resistant battery box for battery holder | $12.95 |
| BH-AA-9V | Battery holder, 9V, 6 AA | $5.45 |
| VG-DARK | Darkness Sensor | $9.95 |
| VH400-2M | Soil Moisture Sensor - 2 Meter Cable | $39.95 |
| Shipping | $4.95 | |
| Total (USD) | $285.10 |
The VegeHub Wi-Fi was the most expensive component of this setup at $140. It comes with firmware that has a web interface for configuration. It’s not a general purpose device and the software on it is closed source and proprietary.
For comparison, a Raspberry Pi or Beagle Bone would be between $35 ~ $65 depending on the model. Single Board Computers (SBCs) are more general purpose devices, and would need additional software and configuration to become a sensor relay. SBCs also consume considerably more power, would not run nearly as long with similar batteries, and additional hardware would be needed to turn the device on and off at regular intervals to read sensor data in order to conserve battery. Embedded hardware like an Arduino might be a more comparable device when it comes to storage and power consumption.
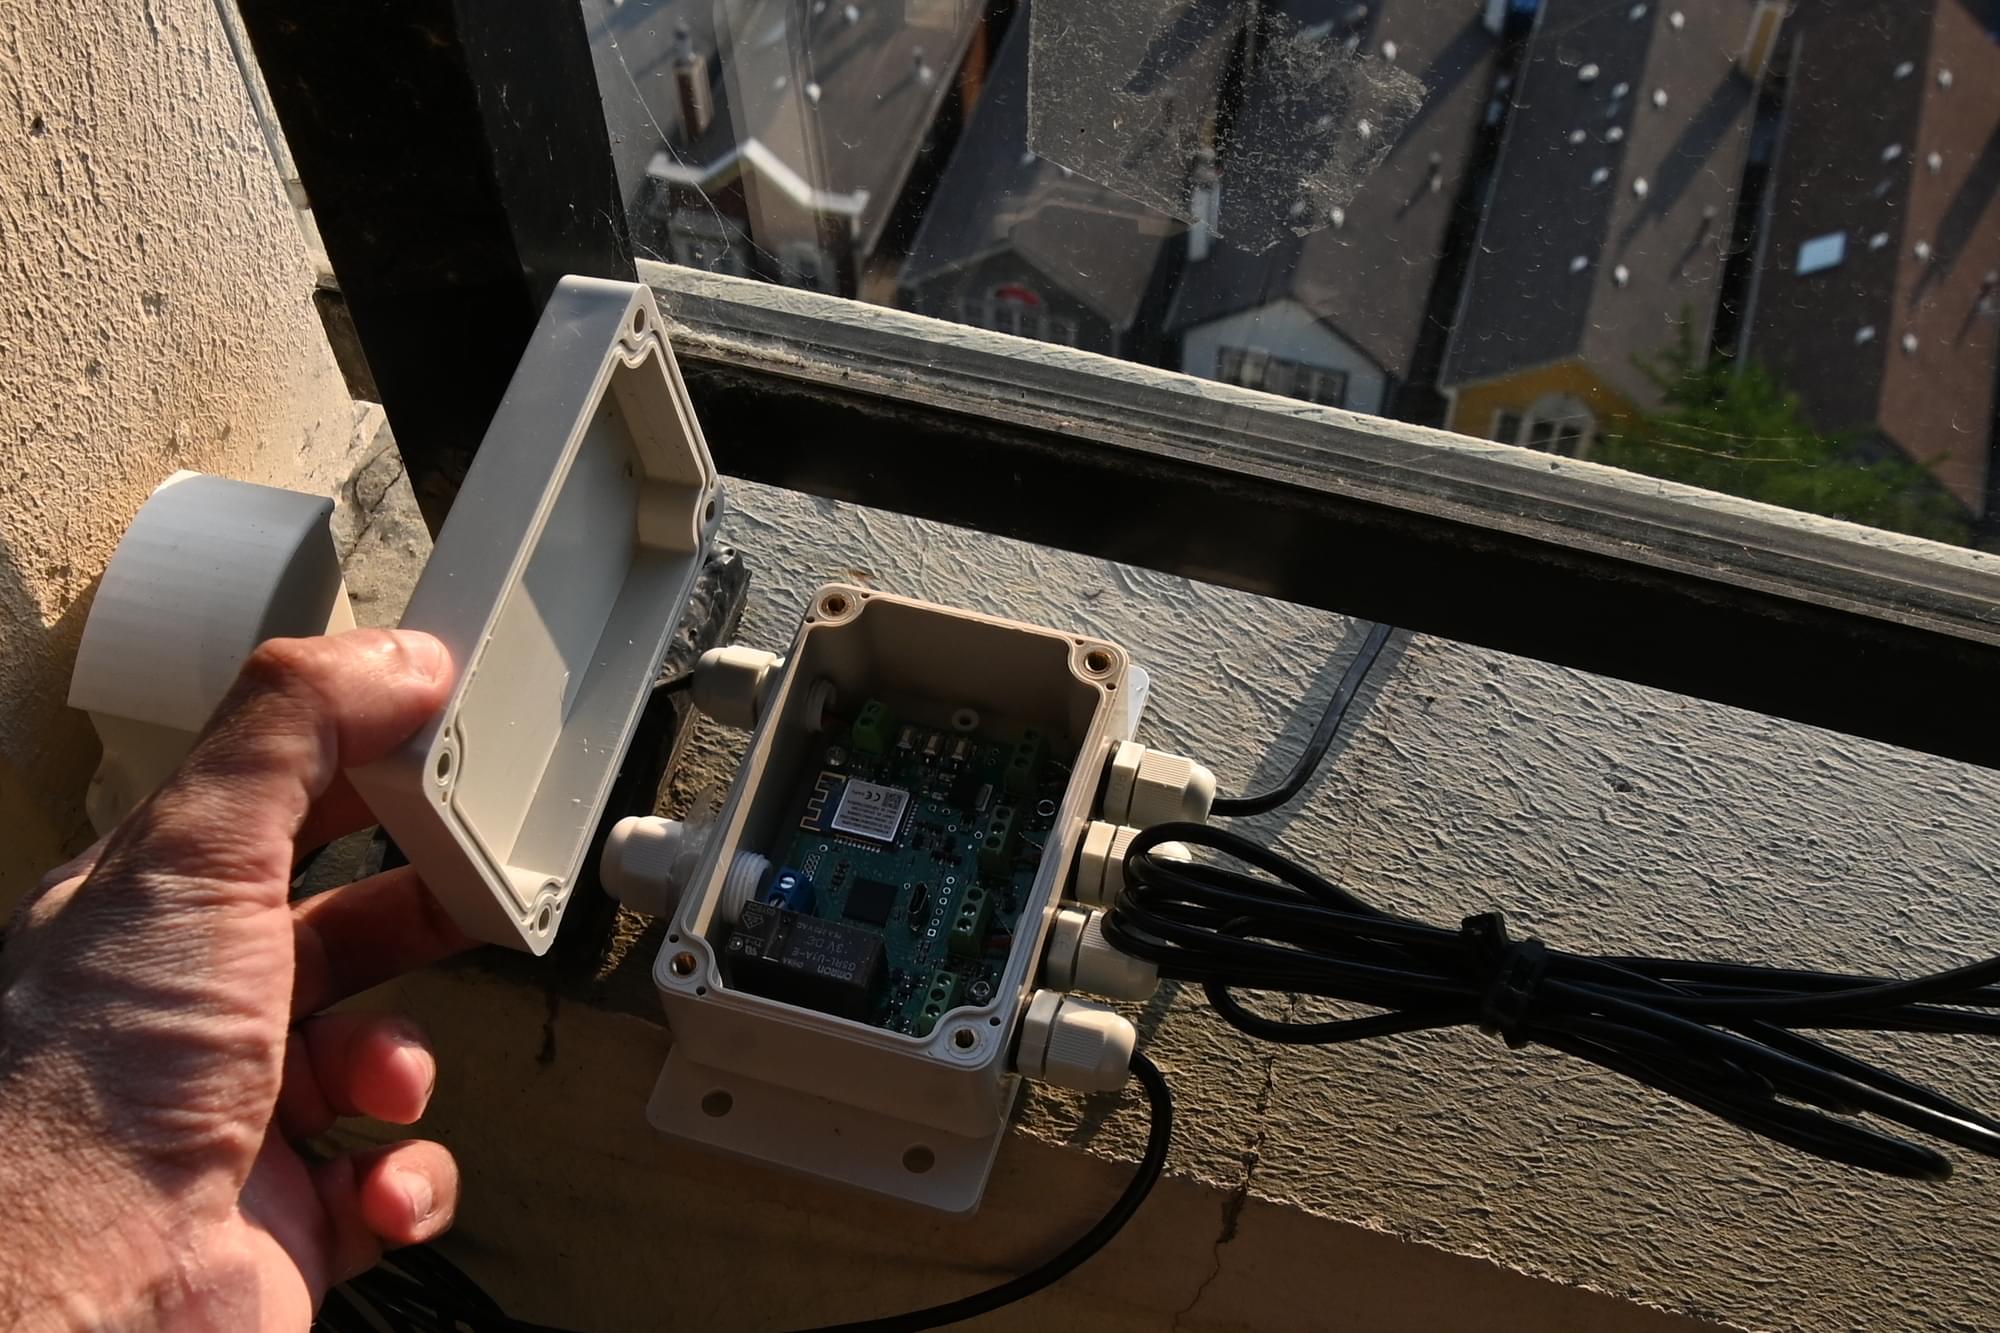
The built in Wi-Fi is unable to see 5Ghz wireless access points, so you must have a Wi-Fi router that supports either 2.4Ghz or dual 2.4Ghz/5Ghz configurations. The range of its Wi-Fi is not very good. I had to move my router about a meter closer to my balcony so the VegeHub could make reliable connections. Sometimes it would stop reporting for hours and I’d have to open the case, just so it could establish a reliable signal. I do live in an apartment, so there may be noise and interference issues. It can store 64 samples per channel in the event it can’t communicate with SenseFlux. If you use the default sample rate of 5 minutes, it can cache about five and a half hours worth of samples.
The VegeHub supports transmitting data over SSL/TLS, but it only appears to have certificates for the major hosting providers it supports. I could not get the VegeHub to send data to an instance of SenseFlux secured by LetsEncrypt certificates. I suspect the limited storage on the VegeHub doesn’t allow for it to have many of the standard certificate authorities found in most operating systems and web browsers. Their website does have instructions for flashing your own certificates via its USB interface, however I didn’t attempt this myself.
The VegeHub has minimal setup and can start logging data to one of its supported cloud providers right out of the box. It does provide an easy way to collect sensor, however the software lacks useful error messages via the web interface. If I were making suggestions to the VegeHub engineers, I’d suggest the following feature set in their next release:
- External waterproof Wi-Fi antenna
- More on-board storage
- Better diagnostics via the web interface
- Include all standard SSL certificates
Even with these limitations, the VegeHub is still an okay solution. Be sure you have a powerful Wi-Fi access point very close to the device, and change the defaults to a higher refresh interval, in order to minimize data loss.
Chronograf
You can use the following to launch a Chronograf container to read and graph data out of InfluxDB.
docker run --name chronograf-sf --network sensenet -p 8888:8888 \
  -v chronograf-state:/var/lib/chronograf \
  -e INFLUXDB_URL=http://influx-sf:8086 \
  -e INFLUXDB_USERNAME=influx \
  -e INFLUXDB_PASSWORD=<SecurePassword> \
  chronograf
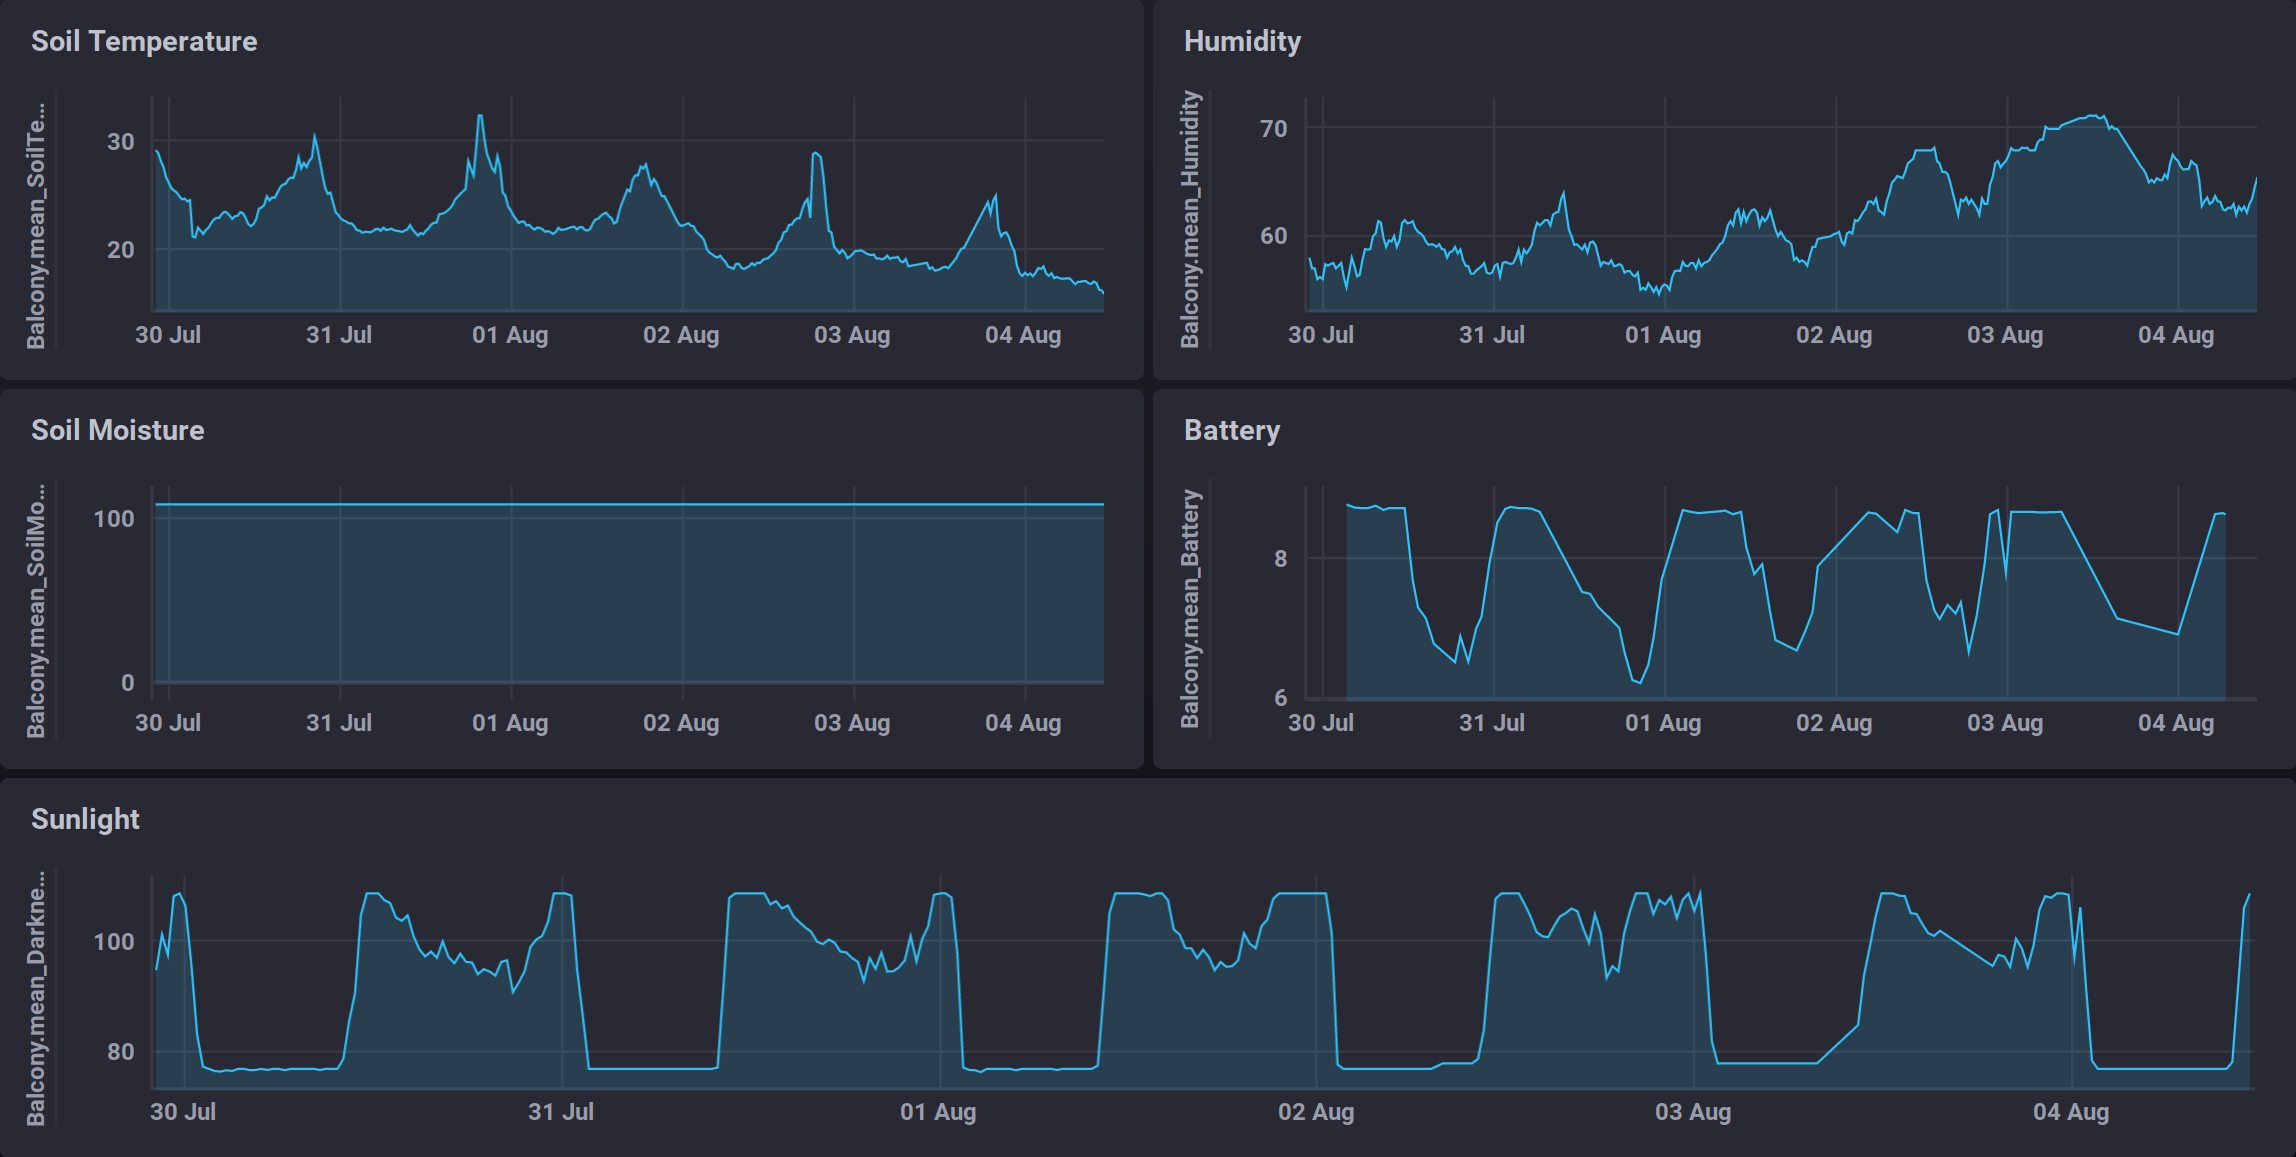
This will expose a web interface at port 8888, which can be used to create graphs and dashboards. The following is a dashboard I created for the VegeHub Sensors.
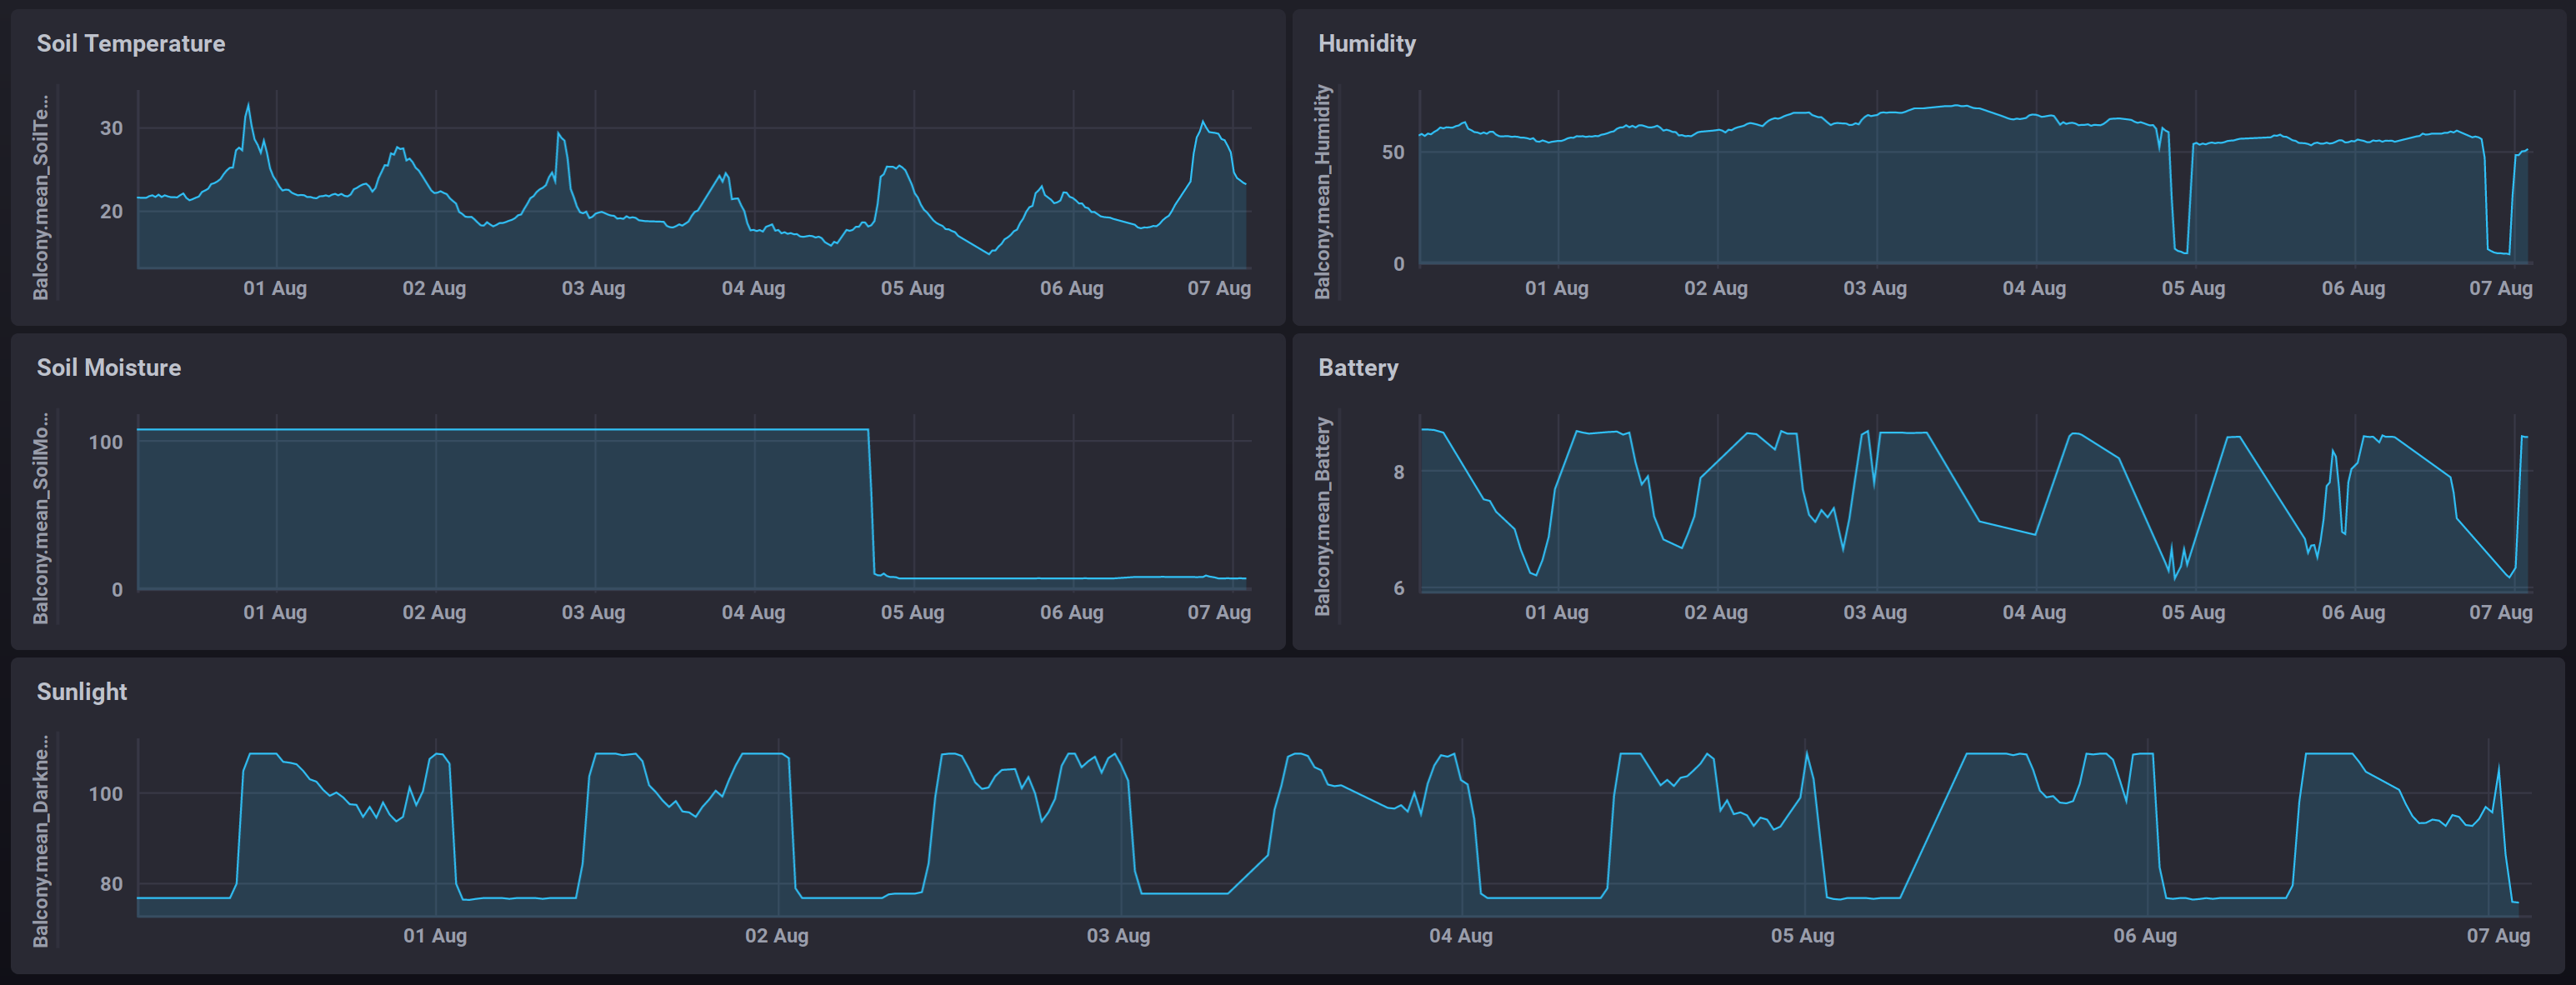
The soil temperature, humidity and light saturation sensors returned reasonable data and pretty much work as expected. The battery sensor has fewer data points as it’s only recorded whenever the VegeHub sends data. I’m assuming it is a simple voltage sensor, which can vary due to the temperature of the batteries.
At first, the soil moisture sensor seemed to continually send a voltage of 3.3, which turned into a reading of 109%. It was recording 0 when it wasn’t in my flower box, so I thought there may have been a short. After repositioning the sensor, I started to get readings between 7% to 9%. I don’t have another soil moisture sensor to compare it to, so I’m not sure how accurate the readings are.
InfluxDB
In my previous sensor network project, I created a web service that could use either MySQL, Postgres or Microsoft SQL as a data storage backend. SenseFlux is my first attempt at using a time series database. An early bug in SenseFlux caused data to be stored as strings instead of floats1, and InfluxDB doesn’t allow for changing a schema or casing from strings back to numeric types2. I ended up having to export the entire database and write a script to reload the data. During my development process, I discovered the following InfluxDB limitations:
- Schema cannot be modified once created
- No ability to delete specific old or invalid records
- Old data is only deleted if it’s configured to expire
InfluxDB has very specific use cases for reading measures from hundreds or thousands of sensors at high intervals. It’s commonly found in devops applications for monitoring data from virtual machines, such as CPU and disk space usage. It’s also used for storing readings from sensors in data centers, such as cabinet temperature or network switch throughput. It works well in situations where old data needs to expire at regular intervals, but it may not be the best tool for measuring inputs from environmental sensors, which tend to have much lower sample rates. InfluxDB may be better suited for large deployments of agriculture sensors.
Conclusions
This was a fun project. I got to try out a new device, write some code and create some pretty graphs. I’d be hesitant to recommend the VegeHub at this point, due to the Wi-Fi connectivity, firmware limitations and data transmission issues. However, I think the device is a good idea and consumers need more products that allow their data to be processed by a variety of services, as well as the ability to keep and host the data themselves. SenseFlux is a simple example of how to write middleware that can transform sensor data, so it can be stored and viewed with a variety of existing open source tools.
-
senseflux Compare Revisions 76cafbdf - 3aeff141 . Retrieved 6 August 2020. ↩
-
Can I change a field’s data type?. Retrieved 4 August 2020. InfluxDB Documentation. ↩